| System | Guide |
|---|
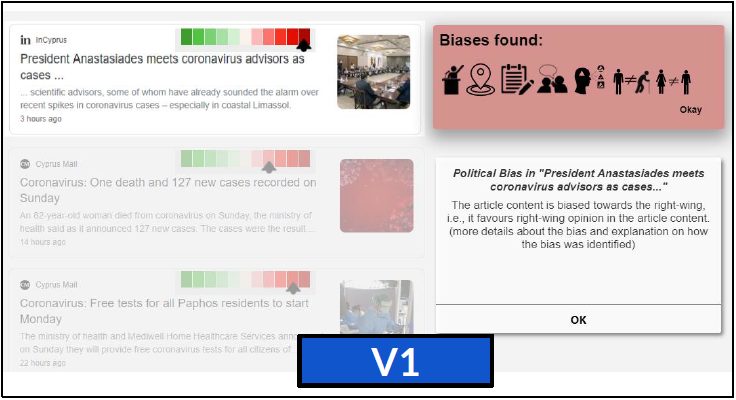
Visualisation 1 (V1)
|
- View prototype: System V1
- Type “coronavirus”.
- Type “coronavirus” and press enter/click to “coronavirus” from the autocomplete suggestions.
- Go to the “News” pages.
- Click on the bias meter of the first article.
- Hover on the icons with your mouse, and get a brief explanation of the particular bias.
- For more information, you can click on the icon and a full explanation will be opened in a new popup frame.
|
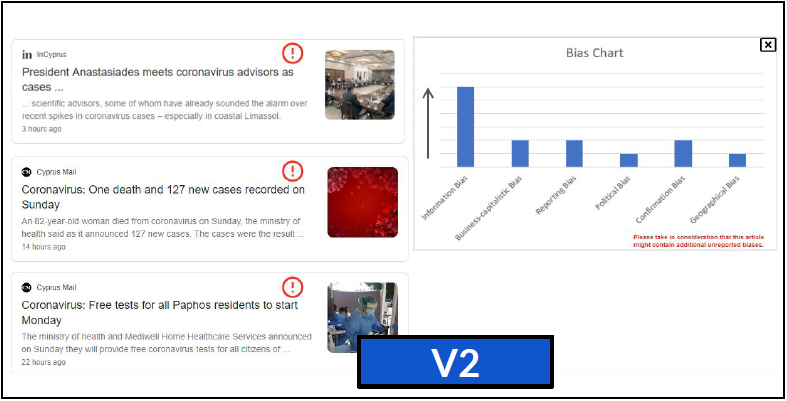
Visualisation 2 (V2)
|
- View prototype: System V2
- Type “coronavirus” and press enter/click to “coronavirus” from the autocomplete suggestions.
- Go to the “News” pages.
- Click on the “bias icon” on the first article to get a bar chart that represents the biases for this article.
- Hover on the bars with your mouse, and get an explanation of the particular bias.
|
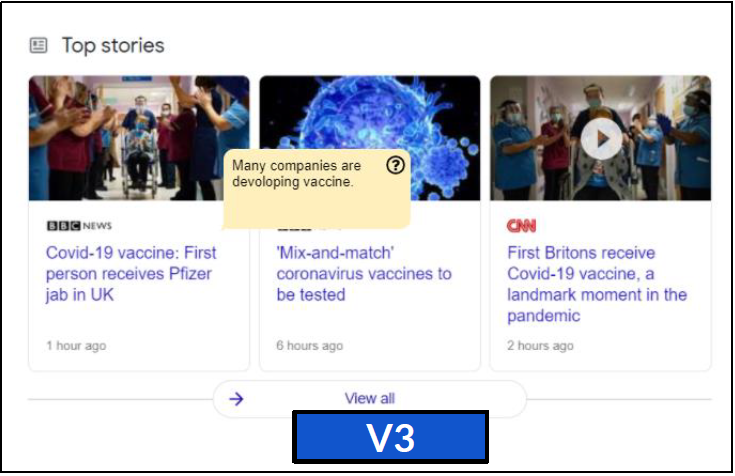
Visualisation 3 (V3)
|
- View prototype: System V3
- Type “coronavirus” and press enter/click to “coronavirus” from the autocomplete suggestions.
- Hover on the news article and the system will inform you if there are aspects related to the topic that are not discussed in the article content.
|
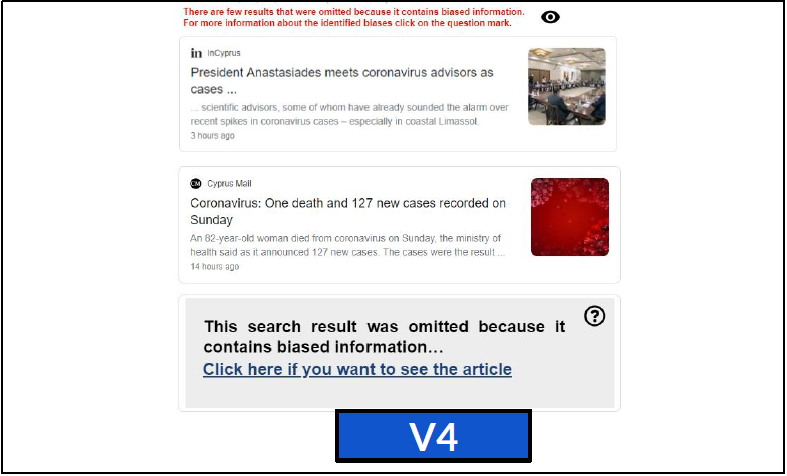
Visualisation 4 (V4)
|
- View prototype: System V4
- Type “coronavirus” and press enter/click to “coronavirus” from the autocomplete suggestions.
- Go to the “News” pages.
- Some articles that contained bias information are omitted/hidden from the results.
- To reveal the article, you may click on the notification. Alternatively, you can click the "eye" icon at the top to reveal all hidden articles.
|
If you have any questions, please contact Monica Paramita (m.paramita@sheffield.ac.uk) or Frank Hopfgartner (f.hopfgartner@sheffield.ac.uk).